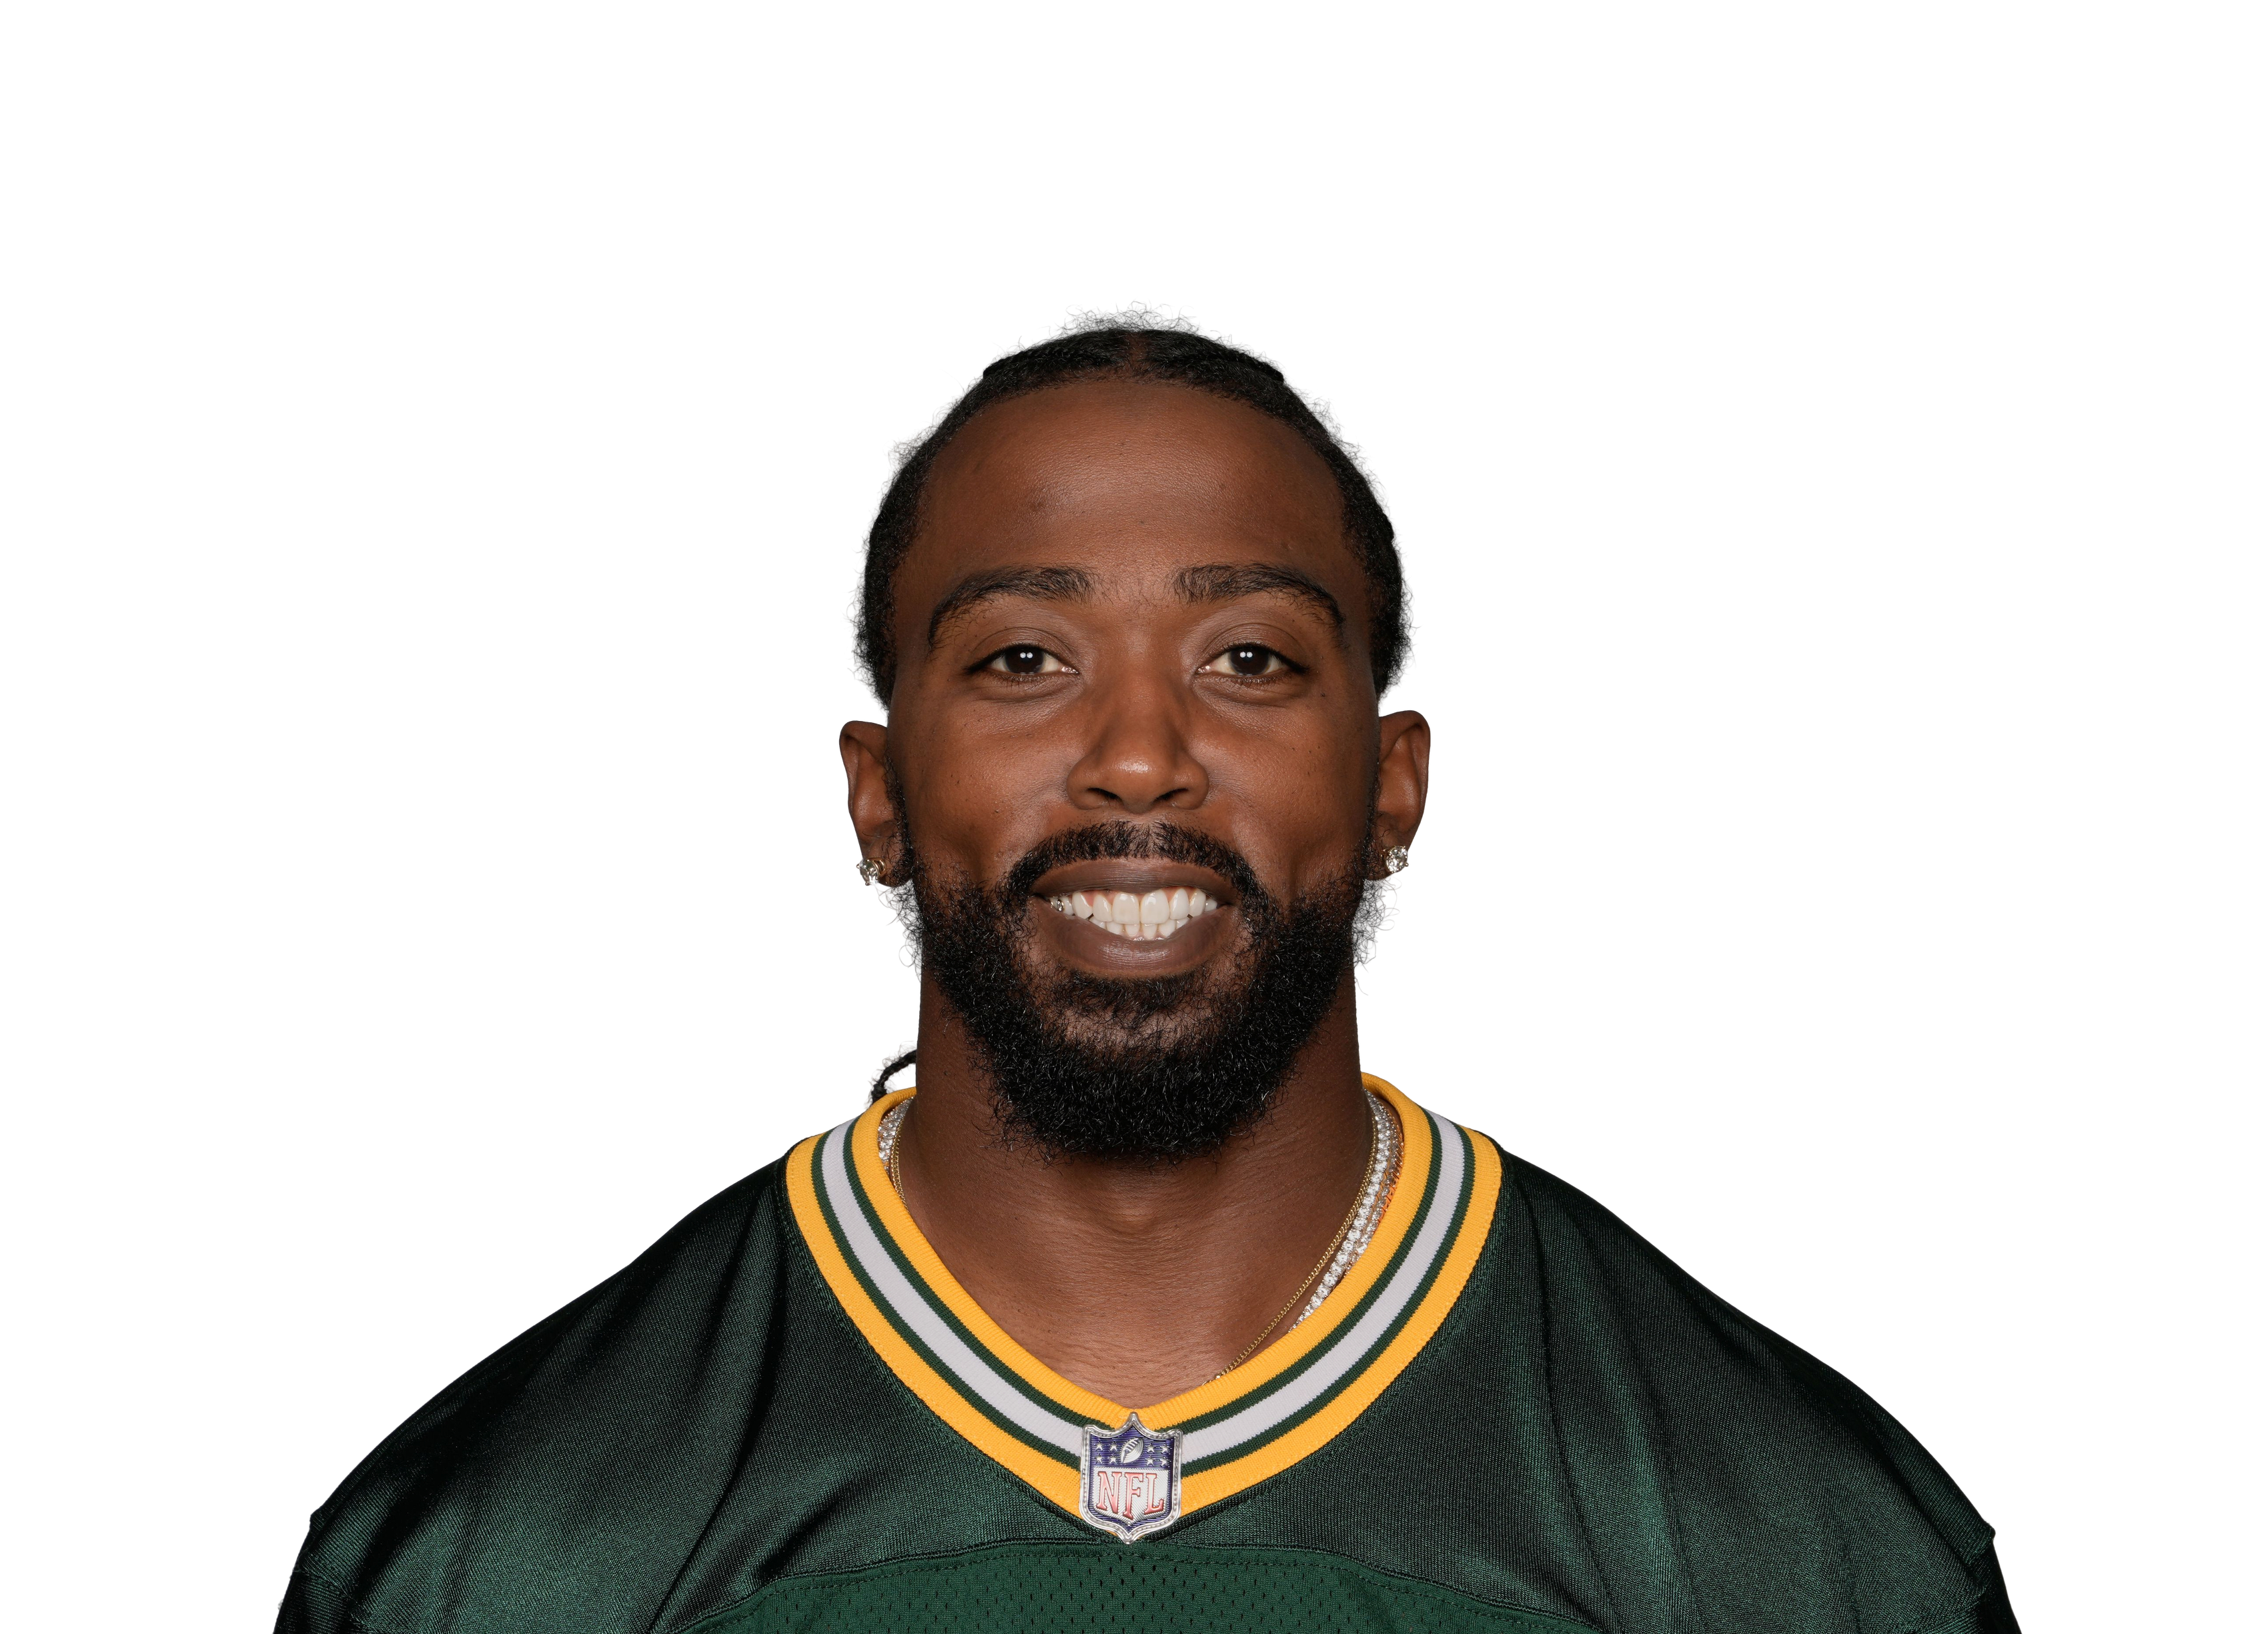
Tyrod Taylor
Box score by season
| Season | Team | G | Cmp | Att | Pass yds | TD | Int | Sacked | Rush | Rush yds | TD | Tgt | Rec | Rec yds | TD | vs ESPN |
|---|---|---|---|---|---|---|---|---|---|---|---|---|---|---|---|---|
| 2025 | NYJ | 6 | 80 | 134 | 779 | 5 | 5 | 14 | 27 | 143 | 1 | 0 | 0 | 0 | 0 | ✓ matches |
| 2024 | NYJ | 2 | 17 | 22 | 119 | 3 | 0 | 0 | 3 | 13 | 0 | 0 | 0 | 0 | 0 | not checked |
| 2023 | NYG | 10 | 116 | 180 | 1,341 | 5 | 3 | 17 | 38 | 197 | 0 | 0 | 0 | 0 | 0 | not checked |
| 2022 | NYG | 2 | 6 | 8 | 58 | 1 | 1 | 3 | 5 | 70 | 0 | 0 | 0 | 0 | 0 | not checked |
| 2021 | HOU | 6 | 91 | 150 | 966 | 5 | 5 | 13 | 19 | 151 | 3 | 0 | 0 | 0 | 0 | not checked |
| 2020 | LAC | 1 | 16 | 30 | 208 | 0 | 0 | 2 | 6 | 7 | 0 | 0 | 0 | 0 | 0 | not checked |
| 2019 | LAC | 4 | 4 | 6 | 33 | 1 | 0 | 0 | 10 | 7 | 0 | 1 | 0 | 0 | 0 | not checked |
| 2018 | CLE | 4 | 42 | 85 | 473 | 2 | 2 | 13 | 16 | 125 | 1 | 0 | 0 | 0 | 0 | not checked |
| 2017 | BUF | 15 | 263 | 420 | 2,799 | 14 | 4 | 46 | 84 | 427 | 4 | 0 | 0 | 0 | 0 | not checked |
| 2017 playoffs | BUF | 1 | 17 | 37 | 134 | 0 | 1 | 2 | 7 | 27 | 0 | 0 | 0 | 0 | 0 | |
| 2016 | BUF | 15 | 269 | 436 | 3,023 | 17 | 6 | 42 | 95 | 580 | 6 | 0 | 0 | 0 | 0 | not checked |
Official scoring from play-by-play. Regular-season totals for 2025 are compared with ESPN's after every rebuild (all players); earlier seasons aren't checked.
Advanced
Below the qualifying bar for this window, so ranks are against qualified players and say less.
Every split
EPA per designed run in each situation, the league in the same situation, and his rank among qualified players with at least 20 designed runs there (1 = best). "Repeats" is how much that split's player-to-player differences carry from one season to the next (2016–25); near zero means it describes the past and predicts little. Click a situation to filter all his numbers to it.
| Situation | Designed runs | EPA/play | Success | Yds/play | League EPA | Rank | Repeats |
|---|---|---|---|---|---|---|---|
| Home / away Setting compare everyone → | |||||||
| Home | 1 | +1.587 | 100% | 2.0 | -0.061 | — | 0.01 |
| Away | 2 | -0.614 | 0% | 1.0 | -0.034 | — | -0.00 |
| Neutral site | 0 | — | — | — | +0.003 | — | — |
| Rest days Setting compare everyone → | |||||||
| Short week (≤5 days) | 0 | — | — | — | -0.045 | — | 0.32 |
| Normal (6–8 days) | 1 | +1.587 | 100% | 2.0 | -0.049 | — | -0.14 |
| Extra rest (9–12 days) | 2 | -0.614 | 0% | 1.0 | -0.061 | — | -0.03 |
| Off a bye (13+ days) | 0 | — | — | — | +0.008 | — | — |
| Indoors / outdoors Weather compare everyone → | |||||||
| Indoors | 0 | — | — | — | -0.077 | — | 0.00 |
| Outdoors | 3 | +0.120 | 33% | 1.3 | -0.031 | — | 0.00 |
| Temperature (outdoors) Weather compare everyone → | |||||||
| Under 40°F | 0 | — | — | — | -0.033 | — | 0.08 |
| 40–59°F | 3 | +0.120 | 33% | 1.3 | +0.012 | — | -0.04 |
| 60–79°F | 0 | — | — | — | -0.062 | — | 0.02 |
| 80°F+ | 0 | — | — | — | -0.024 | — | -0.32 |
| Wind (outdoors) Weather compare everyone → | |||||||
| 0–9 mph | 3 | +0.120 | 33% | 1.3 | -0.020 | — | 0.07 |
| 10–14 mph | 0 | — | — | — | -0.060 | — | 0.12 |
| 15+ mph | 0 | — | — | — | -0.032 | — | 0.11 |
| Rain or snow (outdoors) Weather compare everyone → | |||||||
| Dry | 2 | -0.614 | 0% | 1.0 | -0.030 | — | — |
| Rain or snow | 1 | +1.587 | 100% | 2.0 | -0.036 | — | — |
| Score Game state compare everyone → | |||||||
| Trailing 9+ | 1 | -0.410 | 0% | 0.0 | -0.057 | — | 0.01 |
| Trailing 1–8 | 1 | +1.587 | 100% | 2.0 | -0.053 | — | 0.02 |
| Tied | 1 | -0.818 | 0% | 2.0 | -0.029 | — | 0.10 |
| Leading 1–8 | 0 | — | — | — | -0.036 | — | 0.00 |
| Leading 9+ | 0 | — | — | — | -0.060 | — | -0.13 |
| Win probability Game state compare everyone → | |||||||
| Win prob under 20% | 0 | — | — | — | -0.035 | — | 0.13 |
| Win prob 20–80% | 3 | +0.120 | 33% | 1.3 | -0.040 | — | -0.05 |
| Win prob over 80% | 0 | — | — | — | -0.068 | — | -0.09 |
| Quarter Game state compare everyone → | |||||||
| Q1 | 0 | — | — | — | -0.046 | — | 0.09 |
| Q2 | 1 | -0.818 | 0% | 2.0 | -0.018 | — | -0.04 |
| Q3 | 1 | -0.410 | 0% | 0.0 | -0.037 | — | 0.12 |
| Q4 | 1 | +1.587 | 100% | 2.0 | -0.082 | — | -0.02 |
| OT | 0 | — | — | — | -0.076 | — | — |
| Two-minute Game state compare everyone → | |||||||
| Last 2 min of half | 0 | — | — | — | -0.055 | — | — |
| Rest of game | 3 | +0.120 | 33% | 1.3 | -0.046 | — | — |
| Down Situation compare everyone → | |||||||
| 1st down | 1 | -0.410 | 0% | 0.0 | -0.069 | — | 0.02 |
| 2nd down | 1 | -0.818 | 0% | 2.0 | -0.048 | — | -0.03 |
| 3rd down | 0 | — | — | — | -0.027 | — | -0.14 |
| 4th down | 1 | +1.587 | 100% | 2.0 | +0.448 | — | — |
| 3rd-down distance Situation compare everyone → | |||||||
| 3rd & 1–3 | 0 | — | — | — | +0.052 | — | — |
| 3rd & 4–6 | 0 | — | — | — | -0.084 | — | — |
| 3rd & 7+ | 0 | — | — | — | -0.324 | — | — |
| Field position Situation compare everyone → | |||||||
| Own 20 and in | 0 | — | — | — | -0.109 | — | 0.05 |
| Own 50–21 | 0 | — | — | — | -0.058 | — | -0.01 |
| Opp 21–49 | 2 | -0.614 | 0% | 1.0 | -0.028 | — | 0.07 |
| Red zone (opp 20 in) | 1 | +1.587 | 100% | 2.0 | -0.018 | — | 0.06 |
| Formation Style compare everyone → | |||||||
| Shotgun | 2 | -0.614 | 0% | 1.0 | -0.051 | — | 0.03 |
| Under center | 1 | +1.587 | 100% | 2.0 | -0.043 | — | 0.03 |
| Tempo Style compare everyone → | |||||||
| Huddle | 2 | +0.384 | 50% | 2.0 | -0.050 | — | 0.03 |
| No huddle | 1 | -0.410 | 0% | 0.0 | -0.006 | — | 0.03 |
| Yards to go Situation compare everyone → | |||||||
| 1–3 to go | 1 | +1.587 | 100% | 2.0 | +0.088 | — | 0.12 |
| 4–6 to go | 0 | — | — | — | -0.005 | — | -0.02 |
| 7–10 to go | 2 | -0.614 | 0% | 1.0 | -0.090 | — | -0.06 |
| 11+ to go | 0 | — | — | — | -0.165 | — | — |
| Run direction Running compare everyone → | |||||||
| Left | 1 | -0.410 | 0% | 0.0 | -0.043 | — | 0.04 |
| Middle | 2 | +0.384 | 50% | 2.0 | -0.042 | — | 0.16 |
| Right | 0 | — | — | — | -0.010 | — | 0.11 |
| Run gap Running compare everyone → | |||||||
| Outside (end) | 0 | — | — | — | +0.044 | — | -0.03 |
| Off tackle | 1 | -0.410 | 0% | 0.0 | -0.046 | — | -0.00 |
| Inside (guard) | 0 | — | — | — | -0.065 | — | 0.11 |
| Up the middle | 2 | +0.384 | 50% | 2.0 | -0.042 | — | 0.16 |
| Defenders in the box Defense (FTN) compare everyone → | |||||||
| Light box (6 or fewer) | 2 | -0.614 | 0% | 1.0 | -0.034 | — | 0.13 |
| 7 in the box | 1 | +1.587 | 100% | 2.0 | -0.062 | — | -0.02 |
| Stacked box (8+) | 0 | — | — | — | -0.049 | — | 0.34 |
| Pre-snap motion Scheme (FTN) compare everyone → | |||||||
| Motion | 1 | -0.818 | 0% | 2.0 | -0.040 | — | -0.21 |
| No motion | 2 | +0.589 | 50% | 1.0 | -0.054 | — | -0.21 |
| RPO Scheme (FTN) compare everyone → | |||||||
| RPO | 2 | -0.614 | 0% | 1.0 | -0.064 | — | — |
| Not an RPO | 1 | +1.587 | 100% | 2.0 | -0.044 | — | — |
| Offensive personnel Scheme (NGS) compare everyone → | |||||||
| 11 | 1 | -0.818 | 0% | 2.0 | -0.028 | — | -0.10 |
| 12 | 2 | +0.589 | 50% | 1.0 | -0.063 | — | 0.07 |
| 21 | 0 | — | — | — | -0.057 | — | 0.09 |
| 13 | 0 | — | — | — | -0.057 | — | -0.10 |
| 22 | 0 | — | — | — | -0.025 | — | — |
| 10 | 0 | — | — | — | -0.059 | — | — |
| Other | 0 | — | — | — | -0.203 | — | 0.21 |
By season
| Season | Team | Designed runs | EPA/play | Total EPA | Success | Yds/play | Explosive | 1st-down rate |
|---|---|---|---|---|---|---|---|---|
| 2025 | NYJ | 3 | +0.120 | +0.4 | 33.3% | 1.33 | 0.0% | 33.3% |
Definitions. QB plays are dropbacks: passes, sacks and scrambles (spikes left out). QB EPA doesn't charge the passer for a receiver's fumble after the catch. Rushing is designed runs only; receiving is EPA per target. EPA is about ±1.4 points a play, so a split of 50 plays carries roughly ±0.2 of luck.